Hey is it possible to plot a lateral force against slip graph of a specific corner of a track for example on IPG control ?
Hi Enigma
Yes, you can. You can plot quantities vs quantities (for example in your case select in the x-axis Slip Angle), create calculated signals and more things in IPG Control.
You can find more information of how to use IPG Control in its manual (Main GUI → Help → Additional Documents → IPG Control).
There is also a IPG Control video in the Online Tutorials that you might find useful. (All the other videos are good too, so I recomend to have a look to all of them ![]() )
)
Regards
Jose
hey, So lets say the corner i want to graphically analyse is located between 40-42 Seconds within the simulation, how would i plot just that as oppose to the whole track? because when I plot for the force against slip graph for the whole track it becomes very messy.
thank you
Hi Enigma.
There is an option to highlight a time interval, however it still displays the rest of the data. It is in the IPG Control Manual under the section Display Options - Cursors - Analyse Range.
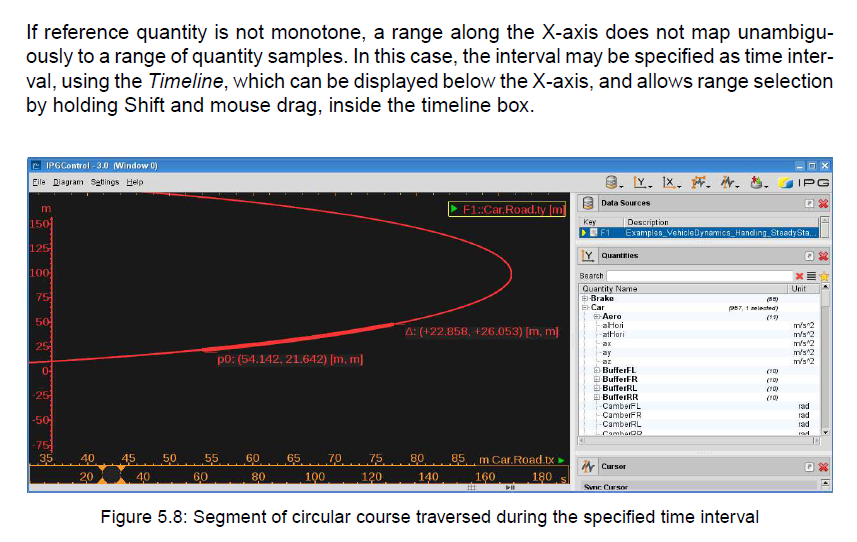
To select the Timeline (Right click on the Diagram and is the last option in the menu displayed)
This might not do what you want so an alternative would be export the data and then plot it for example in excel. To export the road, right click on the Diagram → Export File (You can find more information in the IPG Control manual under Diagram Export - Data Export)
Another option is to load the result file, for example in matlab and create the plots.
You can find more information for that in the Programmers Guide in the section CarMaker utitlities for Matlab - Importing Simulation Results with cmread.
I hope it helps
Regards
Jose